Here is slot rtp explained in a single sentence: it is the share of all money staked that a reel game is designed to pay back across an enormous number of spins, and it is an aggregate figure about the machine’s lifetime, not a forecast about your evening. A game advertised at 96% is built so that, across a sample measured in hundreds of millions of spins, roughly 96 units come back out for every 100 that go in. That remaining 4 units is the structural margin, and it does not switch off at any point.
Most pages that introduce the concept then pivot into recommending games with the highest advertised figures. This breakdown does the opposite: it stays on the maths, explains what the number can and cannot tell you, and separates it cleanly from volatility, which is the figure people usually mean when they talk about how a game “feels”. The short version is that no return percentage makes real-money play a positive proposition over time, and understanding why is more useful than chasing a decimal point.
Slot RTP Explained in One Short Answer
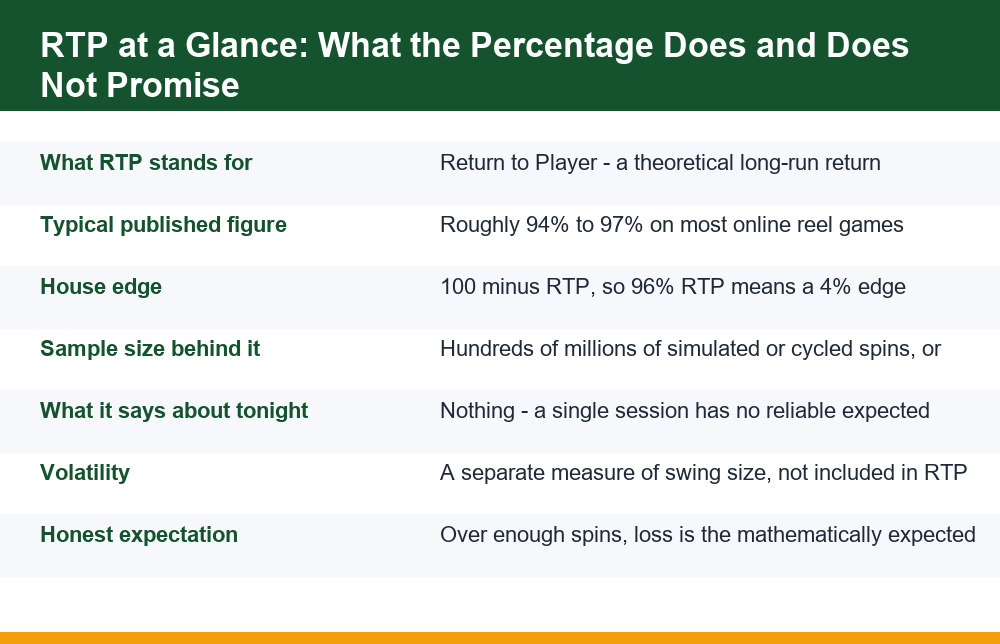
RTP stands for Return to Player. It is a percentage derived from a game’s own paytable and reel mathematics, describing the proportion of total wagered money the game returns as prizes over its full theoretical cycle. With slot rtp explained this way, the figure becomes much less mysterious and much less exciting: it is an accounting ratio about the design of the game, calculated before anybody plays it.
The crucial word is theoretical. The percentage is not measured from your account history, from last week’s results on the server, or from a sample of a few thousand spins. It is computed from the probability of every possible outcome multiplied by the payout attached to that outcome, summed across all of them, then divided by the stake. The answer is exact in the same way that the expected value of a dice bet is exact – and just as unhelpful for predicting any individual roll.
So when a game is listed at 96.1%, the honest reading is: this design, if cycled through its full outcome distribution, returns 96.1 units of prize money per 100 units staked. The remaining 3.9 units is the margin that funds the operation. That margin is not a fee charged at the end of a session. It is baked into the payout table on every single spin, which is why there is no point at which a player has “paid their share” and can expect clean returns afterwards.
It helps to compare the figure to something more familiar. A published return percentage behaves much like the stated fuel consumption on a vehicle: it is a real number, produced under defined conditions, and it tells you something genuine about the design. It also tells you almost nothing about what a single short trip will cost, because a single trip is not the condition the figure was measured under. Nobody treats a laboratory consumption figure as a promise about one journey, and the same restraint belongs here.
Two things follow immediately, and the rest of this breakdown expands on both. First, the percentage says nothing whatsoever about what will happen in the next hundred, thousand or ten thousand spins. Second, it says nothing about the shape of the outcomes – whether returns arrive as frequent small prizes or rare large ones. That second question is volatility, a separate figure entirely.
How the 96% Figure Is Actually Produced
Modern reel games are driven by a random number generator that selects symbol positions independently on each spin. Because the probability of every symbol landing in every position is a fixed, known quantity in the game’s configuration, the designers can enumerate the full outcome space and calculate exactly what the game pays back on average.
In practice this is done two ways, and they should agree. The first is analytic: multiply each winning combination’s probability by its payout, add up the lot, and express the total as a percentage of stake. The second is simulation: run the game’s logic through a very large number of spins and measure the actual return. Independent testing of this kind typically uses simulated runs in the hundreds of millions of spins or more, because that is the scale at which measured return settles close to theoretical return.
That sample size is the single most important fact in this whole topic. The published percentage is a statement about a horizon measured in hundreds of millions of spins. A heavy player might manage a few hundred thousand spins in a year. The gap between those two numbers is not a rounding issue – it is the entire reason individual experience diverges wildly from the headline figure.
There is a second reason to care about how the figure is produced, which is that it tells you what kind of claim it is. It is not a performance statistic collected from real play, and it is not an audited record of what a particular game has paid out to real accounts. It is a design specification, verified by calculation and by simulation against that calculation. When someone cites a percentage with slot rtp explained as though it were a historical payout record, they have misunderstood the category of the number entirely.
What the figure includes and excludes
- Included: base-game line and way wins, scatter payouts, and the average contribution of bonus rounds and free spins weighted by how often they trigger.
- Included: any multiplier or feature mechanic that pays out, valued at its expected contribution rather than its headline maximum.
- Excluded: anything outside the game itself – promotional credits, cashback, loyalty schemes or bonus funds, which sit in a separate layer of maths entirely.
- Excluded: payment fees, currency conversion and any charge applied before money reaches the game balance.
- Often variable: some titles ship in several configurations, so the same game name can carry different published percentages in different places. The number on a review page may not be the number running where you are.
That last point matters more than it sounds. Because the figure is a property of the configuration rather than the title, taking a percentage from a third-party listing and assuming it applies to the build in front of you is a guess. If the number is not displayed in the game’s own information panel, you do not actually know it. This is also the simplest sanity check available: a game that does not state its own return figure anywhere in its help screens has not given you the number, whatever a listing elsewhere says.
House Edge Is Simply 100 Minus RTP
There is no separate calculation here. House edge and return percentage are two views of the same quantity. If a game returns 96% of stake over its theoretical cycle, it retains 4%, and that 4% is the house edge. A 94.5% game carries a 5.5% edge. A 97.2% game carries 2.8%. The two numbers always sum to 100.
Where this becomes concrete is in expected loss per unit of turnover. Turnover – total amount staked, not total amount deposited – is the base the edge applies to. This is the step that catches people out, because the same deposit can generate many times its own value in turnover as winnings are restaked. The table below shows theoretical expected loss across a fixed volume of turnover at several return percentages.
| Published RTP | House edge | Expected loss per 10,000 staked | Expected loss per 100,000 staked |
|---|---|---|---|
| 97.0% | 3.0% | 300 | 3,000 |
| 96.5% | 3.5% | 350 | 3,500 |
| 96.0% | 4.0% | 400 | 4,000 |
| 95.0% | 5.0% | 500 | 5,000 |
| 94.0% | 6.0% | 600 | 6,000 |
| 92.0% | 8.0% | 800 | 8,000 |
Read the right-hand column carefully, because it is the honest answer to “how much does the margin cost?” Nobody stakes 100,000 in one go, but a session that recycles a modest balance through many spins reaches that turnover figure far faster than most players estimate. The expected loss is not a worst case. It is the central expectation around which real results scatter.
A short worked example makes the turnover point unavoidable. Suppose a balance of 2,000 is played at 20 per spin on a 96% design. Each spin removes, on average, 4% of 20 – that is 0.80 of expected cost per spin. Two thousand units of balance therefore supports roughly 2,500 spins of expected play before the margin alone has absorbed it, and those 2,500 spins represent 50,000 of turnover from a 2,000 deposit. The deposit was staked twenty-five times over. That multiplication is why losses routinely feel larger than the headline percentage suggests they should be.
The same arithmetic is what makes promotional offers so hard to evaluate, because a wagering condition is a turnover requirement multiplied by the house edge of whatever game clears it. If you want the full version of that calculation, the breakdown of how casino bonus wagering requirements are calculated works through it step by step with the same arithmetic used here.
Why Your Own Results Never Match the Published Number
This is the most common question people bring to the topic, and the answer is simply sample size. A theoretical return is the mean of a distribution. Any individual sample drawn from that distribution has a spread around the mean, and the smaller the sample, the wider the spread. At a few hundred spins the spread is enormous – you might measure an effective return far below or far above the published figure, and neither result would be remotely surprising.
It helps to picture the outcome distribution of a typical reel game. The overwhelming majority of spins return nothing. A large minority return less than the stake. A small fraction return a few times the stake. A very small fraction return a large multiple. The mean sits at 96%, but almost no individual spin returns 96% of its stake – that value is an average of outcomes that are mostly zero and occasionally large.
This is the part of slot rtp explained that most reading material skips, because it is the part that removes the drama. The reason your results diverge is not malfunction, not a rigged configuration, and not a pattern you failed to spot. It is that you are observing a tiny sample of a high-variance distribution. Several further factors widen the gap:
- Sample size. Published figures settle only across enormous numbers of spins. A session is a statistically meaningless slice of that.
- Variance from the feature. In many designs a large share of the total return is delivered through a bonus round that triggers rarely. Go a session without triggering it and you have simply not sampled most of the game’s return.
- Turnover, not deposit. People compare their loss to what they deposited. The percentage applies to what they staked, which is usually far larger.
- Stake changes mid-session. Return is a ratio of stake, so varying bet size across a session makes informal mental tracking inaccurate.
- Selective memory. Large single wins tend to be remembered vividly while long flat stretches are not, which distorts how generous a game feels compared with what it returned.
- Mixed products. Table and live products carry their own, different margins, so a session that mixes formats cannot be assessed against a single reel game’s figure.
There is a further complication worth naming, because it affects anyone who tries to keep their own records. Measuring your personal return requires tracking total stake and total return separately, and almost nobody does that accurately across a long period. What people usually track is net balance change, which is a different quantity and far more volatile. Two players with identical total stakes and identical total returns can end a month with very different balance histories, and the one who happened to hit a feature late will describe the game completely differently from the one who hit it early.
That last item in the list above is worth separating out, because people often assume one percentage covers everything in a lobby. It does not – the structure and margin of dealer-run products works differently from software-run reels, as set out in the comparison of how live dealer tables differ from software-driven games.
Why No Losing Streak Makes a Win Due
This is the belief that does the most damage, and it is worth stating the correction bluntly: nothing is ever due. Each spin is an independent event. The generator does not retain a memory of previous outcomes, and the probability of any given result on the next spin is identical to what it was on the first spin of the day, regardless of what came before.
The confusion comes from a misreading of how averages work. People reason that if the long-run return is 96%, and recent returns have been far below that, then above-average returns must be coming to restore the balance. But averages do not self-correct. They converge, which is a different mechanism. Convergence happens because the weight of any early stretch becomes progressively smaller as the total sample grows, not because later outcomes compensate for earlier ones. A poor run is not cancelled; it is diluted by sheer volume.
A small arithmetic illustration helps. Imagine a thousand spins have returned well under the mean. Across the next hundred thousand spins, those thousand poor spins make up roughly one per cent of the total sample, and their drag on the running average shrinks accordingly. Nothing paid them back. They simply stopped mattering to the figure. That is convergence, and it offers no comfort whatsoever to the player who sat through the poor stretch, because the dilution happens in the statistics rather than in anyone’s balance.
The practical consequence is that a long losing stretch gives you no information at all about the next spin, and it certainly does not improve the expected value of continuing. If anything, the reasoning works the other way round: the belief that a win is overdue is one of the most reliable precursors to staking more than was intended. Reading meaning into streaks is an ordinary feature of how people interpret random sequences, and fast, repetitive products give that tendency a great deal to work with. If play has started to feel compulsive rather than casual, free and confidential support is available – GamCare’s support service for people affected by gambling is a non-commercial starting point.
The same logic kills every variant of the idea. A game that has just paid a large prize is not “empty”. A game that has not paid in hours is not “loaded”. Switching games mid-streak changes nothing, and neither does changing stake size, play speed, or time of day. A short honesty note belongs here: real-money play is for adults only, carries genuine financial risk, and over sufficient volume loss is the mathematically expected outcome. No pattern of play alters that.
Volatility Is a Completely Separate Number
If return percentage is the mean of the outcome distribution, volatility describes its spread. Two games can share an identical 96% figure and feel nothing alike, because one delivers that return through frequent small prizes while the other delivers it through rare large ones. Treating the two numbers as one is the most common analytical error in this subject, and it is where slot rtp explained badly does the most damage to people’s expectations.
The distinction is easiest to see with a deliberately simplified pair of designs, both returning 96%:
| Property | Low-volatility design | High-volatility design |
|---|---|---|
| Theoretical return | 96% | 96% |
| House edge | 4% | 4% |
| Hit frequency | Prizes land often | Prizes land rarely |
| Typical prize size | Small, often below stake | Occasionally very large |
| Session-to-session spread | Narrow | Extremely wide |
| Spins needed to approach the mean | Large | Vastly larger |
| Expected loss over equal turnover | Identical | Identical |
Note the last row. Volatility changes how results are distributed, not what the average is. A high-variance design does not cost more or less over the long run than a low-variance one with the same return figure – it simply makes any given session less representative of that figure. This is why high-variance play produces both the memorable large results and the long barren stretches, and why neither tells you anything useful about the underlying maths.
There is also a practical consequence for anyone trying to reason about their own play. With a high-variance design, the number of spins required before measured return comes anywhere near the published figure is far beyond what an individual will ever play. In other words, for the games most people find most engaging, the published percentage is the least applicable to personal experience. That is not a criticism of the number; it is a limit on what the number was ever meant to describe.
Two related terms are worth untangling while they are in view. Hit frequency is the proportion of spins that return anything at all, including returns smaller than the stake, and it is often the number people mentally treat as generosity. Maximum win, usually quoted as a multiple of stake, describes the ceiling of the distribution rather than its centre and can be enormous on designs whose average return is unremarkable. Neither figure constrains the return percentage, and the return percentage constrains neither of them. Three independent numbers describe three different properties of the same design, and collapsing them into one impression of whether a game is “good” discards most of the information.
Does a Higher Percentage Mean More Wins?
No – and the reason is the volatility point above. A higher return figure means a smaller structural margin per unit of turnover. It does not mean prizes arrive more often, arrive larger, or arrive at all within any given session. Hit frequency is a separate design parameter that the return percentage does not constrain in either direction.
This is exactly where most introductions to the subject turn into a sales pitch, with the implication that selecting high-percentage games converts a losing proposition into a winning one. It does not. Moving from a 94% design to a 97% design reduces expected loss per unit of turnover from six units per hundred to three. The expected outcome is still a loss. Halving a negative number leaves it negative.
It is worth being precise about what the difference does buy, because dismissing it entirely would be dishonest too. Over very large volumes of turnover, a smaller margin genuinely costs less. That is a real arithmetic fact. What it is not is an edge, a strategy, or a route to profit, and the gap between “loses more slowly on average” and “wins” is the gap that promotional pages work hardest to blur.
What the percentage does and does not control
- It does control the average proportion of total stake returned across the game’s full theoretical cycle.
- It does control expected cost per unit of turnover, which is simply 100 minus the figure.
- It does not control how often any prize lands, which is hit frequency.
- It does not control how large the biggest possible result is, which is the maximum win multiple.
- It does not control how widely session results scatter, which is volatility.
- It does not control anything at all about the next spin, which is independent of every spin before it.
The honest framing is that the percentage is a cost-of-play figure, in the same category as a spread or a commission. Comparing them tells you which product is structurally cheaper to churn money through. It does not identify a product that pays you, because no setting of that number produces a positive expectation for the player.
Mistakes to Avoid When Reading Return Figures
With slot rtp explained properly, most remaining confusion comes down to a handful of recurring errors. This checklist is the short version of everything above, framed as things to stop doing.
- Treating the percentage as a session forecast. It is a long-run aggregate over enormous numbers of spins. It makes no prediction about any realistic amount of play.
- Comparing loss against deposits instead of turnover. The margin applies to total staked. Restaked winnings count, which is why real losses outpace naive estimates.
- Assuming a number from a review page applies to the build in front of you. Configurations differ. If the game’s own information panel does not state it, you do not know it.
- Mistaking volatility for generosity. Frequent small prizes and rare large ones can sit behind the same percentage. Feel is not maths.
- Reading streaks as signals. Independent events carry no memory. Nothing is ever due, warm, cold, loaded or empty.
- Expecting averages to self-correct. They converge by dilution over vast samples, not by compensating you for a bad run.
- Ignoring the layer above the game. Promotional conditions, turnover requirements and payment fees sit outside the percentage entirely and can dominate the real cost of play.
- Letting the number justify a larger stake. A smaller margin reduces expected loss per unit staked; raising the stake raises turnover and cancels the benefit immediately.
- Confusing maximum win with expected return. A headline ceiling describes the rarest tail of the distribution, not its centre, and says nothing about average cost.
One further point sits outside the maths but belongs in any honest treatment. Scrutinising a decimal place is a poor use of attention compared with the practical risks attached to real-money accounts – credential reuse, unverified payment flows, and the social-engineering approaches that target people mid-session. The checklist for locking down an online casino account covers that side, and the time spent there is better invested than the time spent comparing return percentages.
The closing summary is short. The published figure is a real, well-defined property of a game’s design. It describes a theoretical long-run return across a sample no individual will ever play. It converts directly into a house edge of 100 minus itself, and that edge applies to every unit of turnover with no pause and no reset. Volatility explains the texture of results; the return figure explains their average; hit frequency and maximum win describe yet other properties again. None of these numbers offers a method, and no arrangement of them makes the expected outcome anything other than a loss.
Frequently Asked Questions
What does 96% RTP actually mean?
It means the game is designed so that, across its full theoretical cycle – a sample typically measured in hundreds of millions of spins or more – roughly 96 units of prize money are returned for every 100 units staked. It is an aggregate property of the game’s paytable and reel mathematics, calculated before anyone plays. It is not a forecast of what a session, a day or even a year of individual play will return, and almost no single spin returns anything close to 96% of its stake.
Is house edge the same as RTP?
They are two views of the same quantity. House edge is 100 minus the return percentage, so a 96% game carries a 4% edge and a 94.5% game carries 5.5%. The two always sum to 100. The edge applies to total turnover – every unit staked, including restaked winnings – rather than to deposits, which is why real losses are usually larger than people estimate from their deposit history.
Does a higher RTP mean I will win more often?
No. A higher percentage means a smaller structural margin per unit of turnover, nothing more. How often prizes land is hit frequency, a separate design parameter that the return figure does not constrain. Moving from a 94% design to a 97% one reduces expected loss from six units per hundred staked to three, but the expected outcome is still a loss – halving a negative number leaves it negative.
Why do my results not match the published RTP?
Sample size. The published figure is the mean of a very wide outcome distribution, and it settles close to that mean only across enormous numbers of spins. A session samples a statistically meaningless slice of that, so measured returns far below or far above the headline figure are entirely unremarkable. The gap is widened further by bonus features that carry a large share of total return but trigger rarely, by varying stake sizes, and by comparing losses against deposits rather than turnover.
Is a slot due for a win after a losing streak?
No. Each spin is an independent event and the generator retains no memory of previous outcomes, so the probability of any result on the next spin is identical to what it was on the first spin. Averages do not self-correct – they converge because the weight of any early stretch is progressively diluted as the total sample grows, not because later outcomes compensate for earlier ones. A poor run gives no information about what comes next and does not improve the expected value of continuing.
What is the difference between RTP and volatility?
The return percentage is the mean of a game’s outcome distribution; volatility is its spread. Two games can share an identical 96% figure and feel completely different, because one delivers that return as frequent small prizes and the other as rare large ones. Volatility changes how results are distributed, not what the average is – expected loss over equal turnover is the same. Its practical effect is that high-variance designs require vastly more spins before measured return approaches the published figure.